Project Overview:
Predicting blood sugar spikes from personal diet
The main purpose of this project was to identify dietary factors that contribute to spikes in blood sugar levels for a pre-diabetic individual. Four models were used to predict height of blood sugar spikes: linear regression, weighted k-nearest neighbor, random forest, and boosted regression. Each model was tuned to optimize the root mean squared error. A description of the analysis methods is given in the About page.
For analysis, see links below:
Results
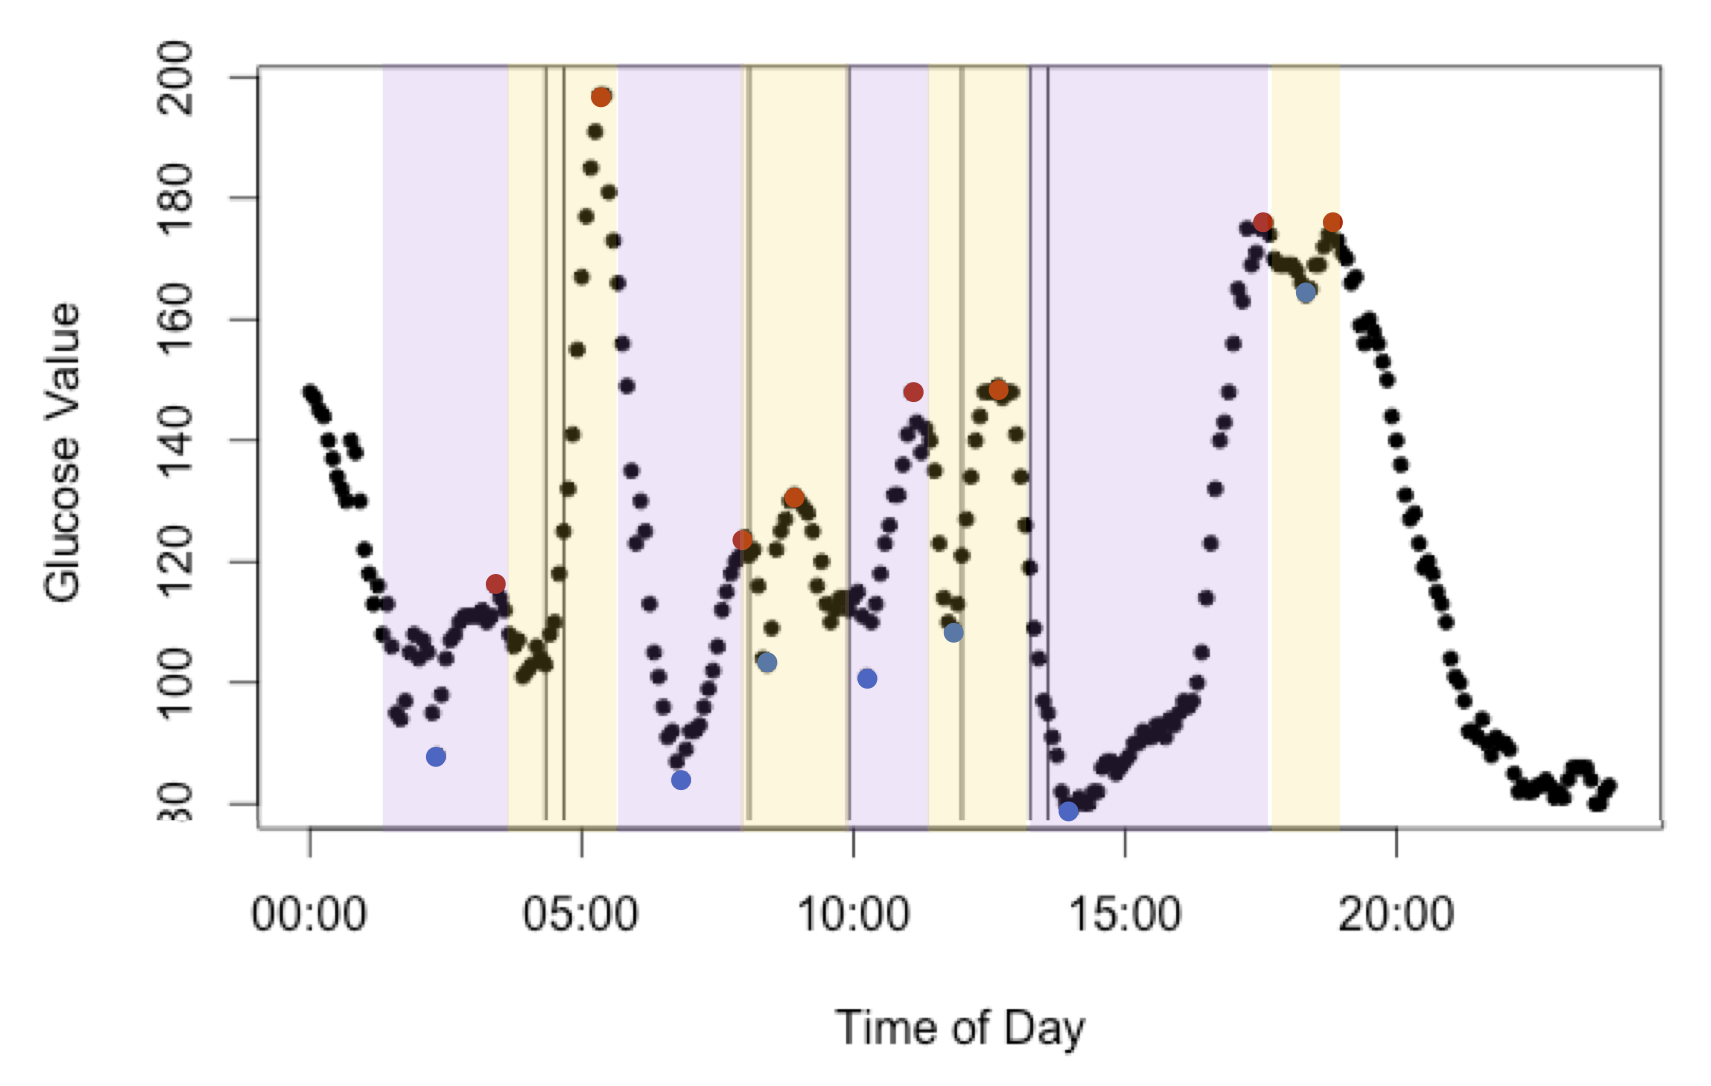
The RMSE is quite high for all models considering the range of blood sugar spikes is 0 to 200 with a median of 54, making this at minimum a 12.5% error and more often upwards of a 50% error. However, given the weak predictors, these models perform quite well and will hopefully improve after more observations are recorded and more uncorrelated features are added to the models.
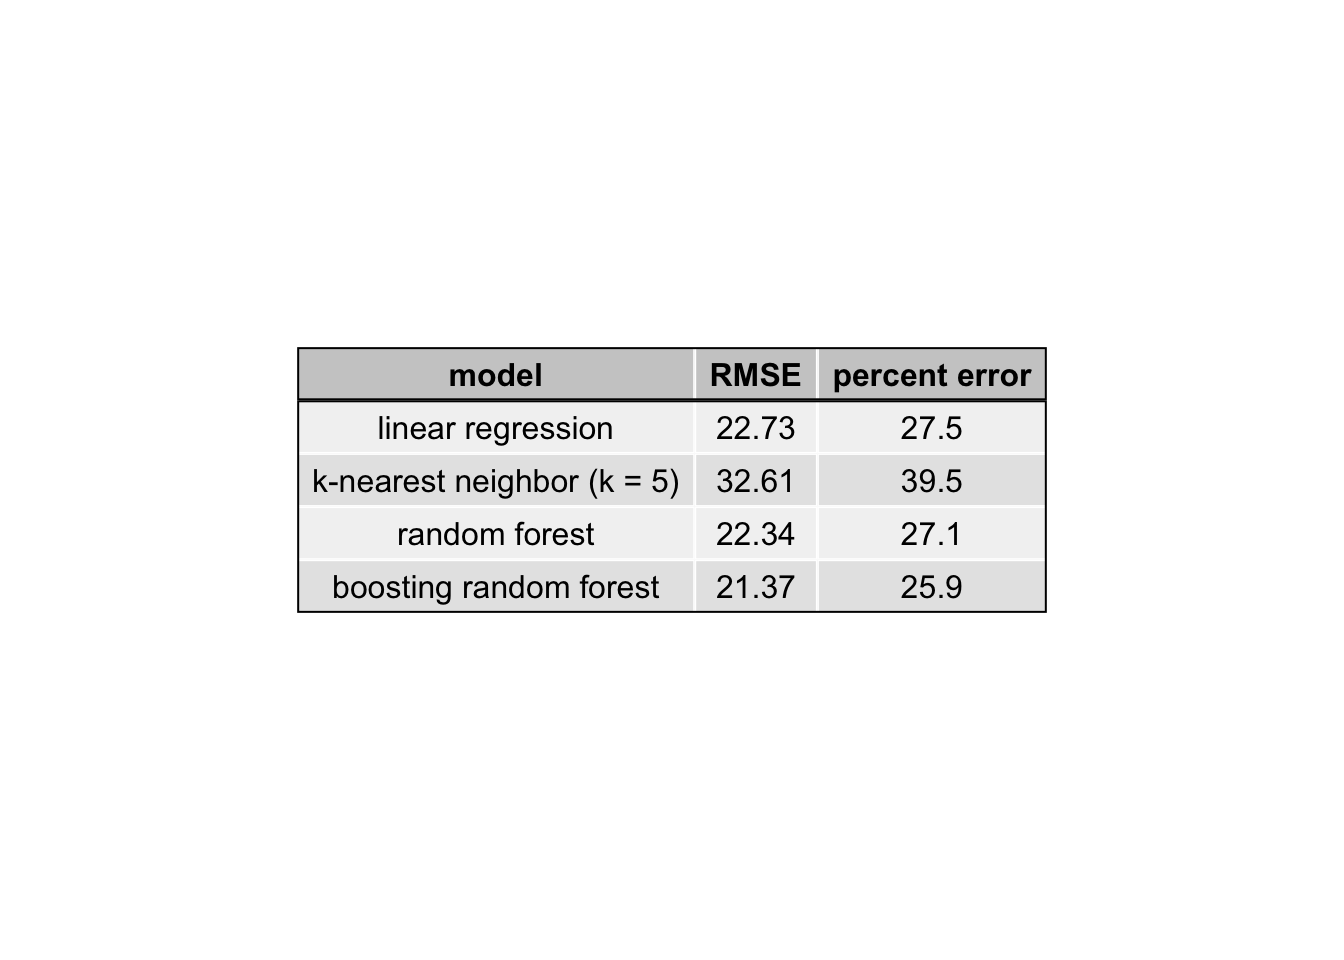
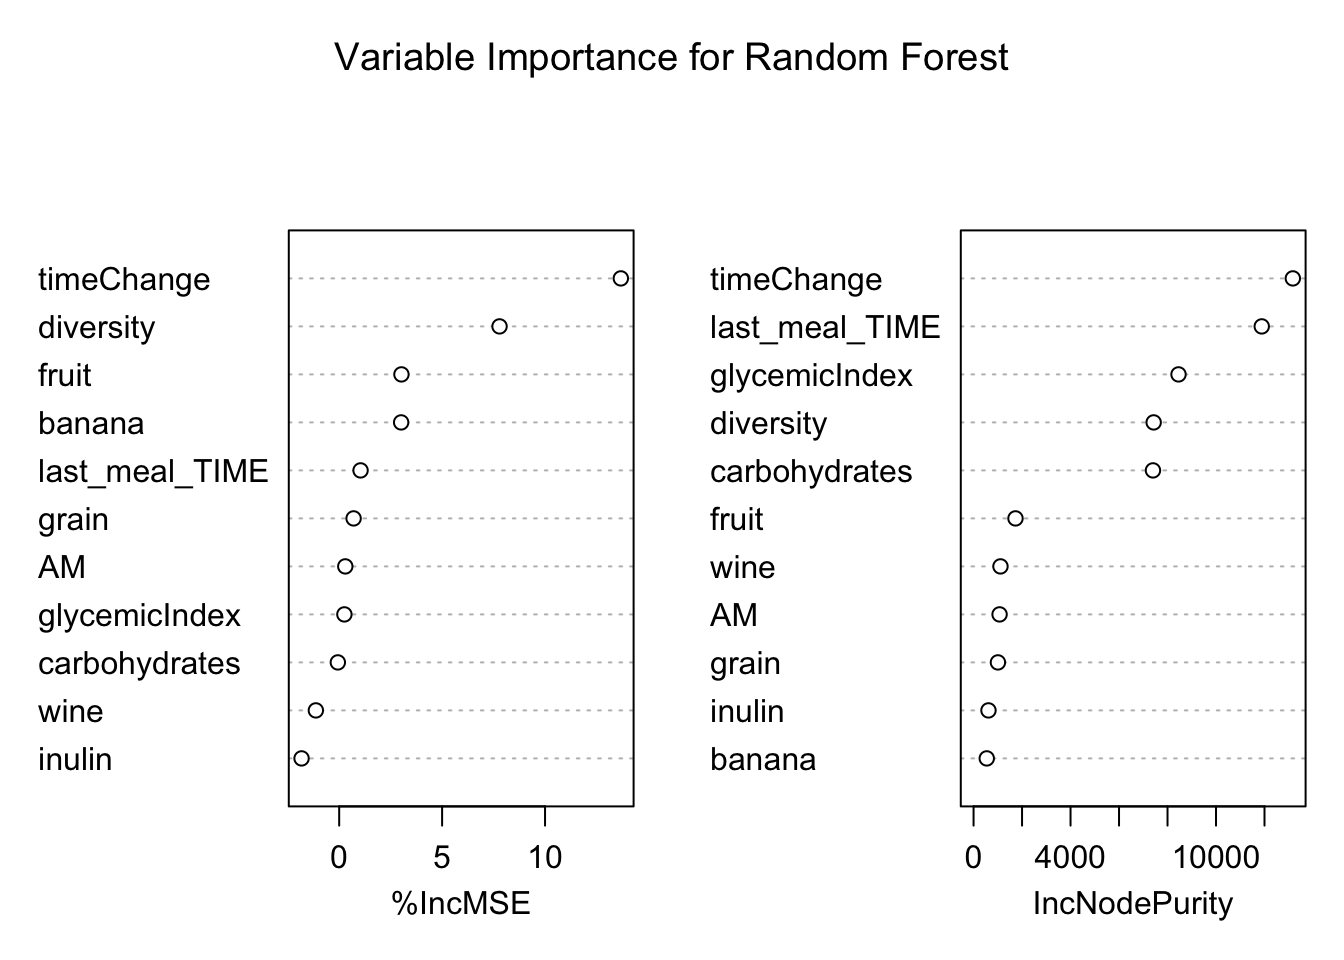
Of the four models built, all perform quite similarly, but Random Forest and KNN (k=11) perform slightly better. The reported predictions of all models were made by using the same training and set sets. The training was random 75% sample of the data and the test set was the remaining 25% of the data. These predictions are reported for all models in prediction.txt. The most influencial variables in the random forest model can be seen in below; however, the clinical relevance of these findings may be poor given the high RMSE for the models.
This R Markdown site was created with workflowr