Preprocessing dietary and CGM data
Heather Hall
2015-08-05
Last updated: 2017-09-13
Code version: 2c087f8
Load libraries
library(lubridate) # work with times
library(leaps) # regsubset
library(kknn) # k nearest neighbor
library(gbm) # boosting
library(randomForest) # random forest
library(gridExtra); library(grid); library(gtable) # plot tables
library(ggplot2) # ggplot
library(scales) # easy plotting of dates

# load personal library
source(paste(personal.library.directory, "project_library.R", sep = "/"))
Read in files
# read in myfitnesspal data and recorded meal timing
food.logs = readMyFitnessPal(food.data.path, conversion.chart.path)
food.times <- read.delim(food.timing.file, stringsAsFactors = FALSE)

# read in glucose data
cgm.readings = readDexcomFile(glucose.file)
preview of CGM data
head(cgm.readings)
  GlucoseDisplayDate GlucoseDisplayTime GlucoseValue         DisplayTime
1            3/29/15              11:53          100 2015-03-29 11:53:00
2            3/29/15              11:58          111 2015-03-29 11:58:00
3            3/29/15              12:03          113 2015-03-29 12:03:00
4            3/29/15              12:08          114 2015-03-29 12:08:00
5            3/29/15              12:13          116 2015-03-29 12:13:00
6            3/29/15              12:18          121 2015-03-29 12:18:00

example.date = "3/30/15"
example.CGM = cgm.readings[cgm.readings$GlucoseDisplayDate == example.date, ]
example.CGM$GlucoseDisplayTime <- as.POSIXct(strptime(example.CGM$GlucoseDisplayTime, format="%H:%M"))

ggplot(example.CGM) +
  aes(x = GlucoseDisplayTime, y = GlucoseValue, group = GlucoseDisplayDate) +
  geom_point() + geom_line() +
  scale_x_datetime(breaks = date_breaks("6 hour"), labels = date_format("%H:%M")) +
  labs(x = "time of day (HH:MM)", y = "interstitial glucose (mg/dL)")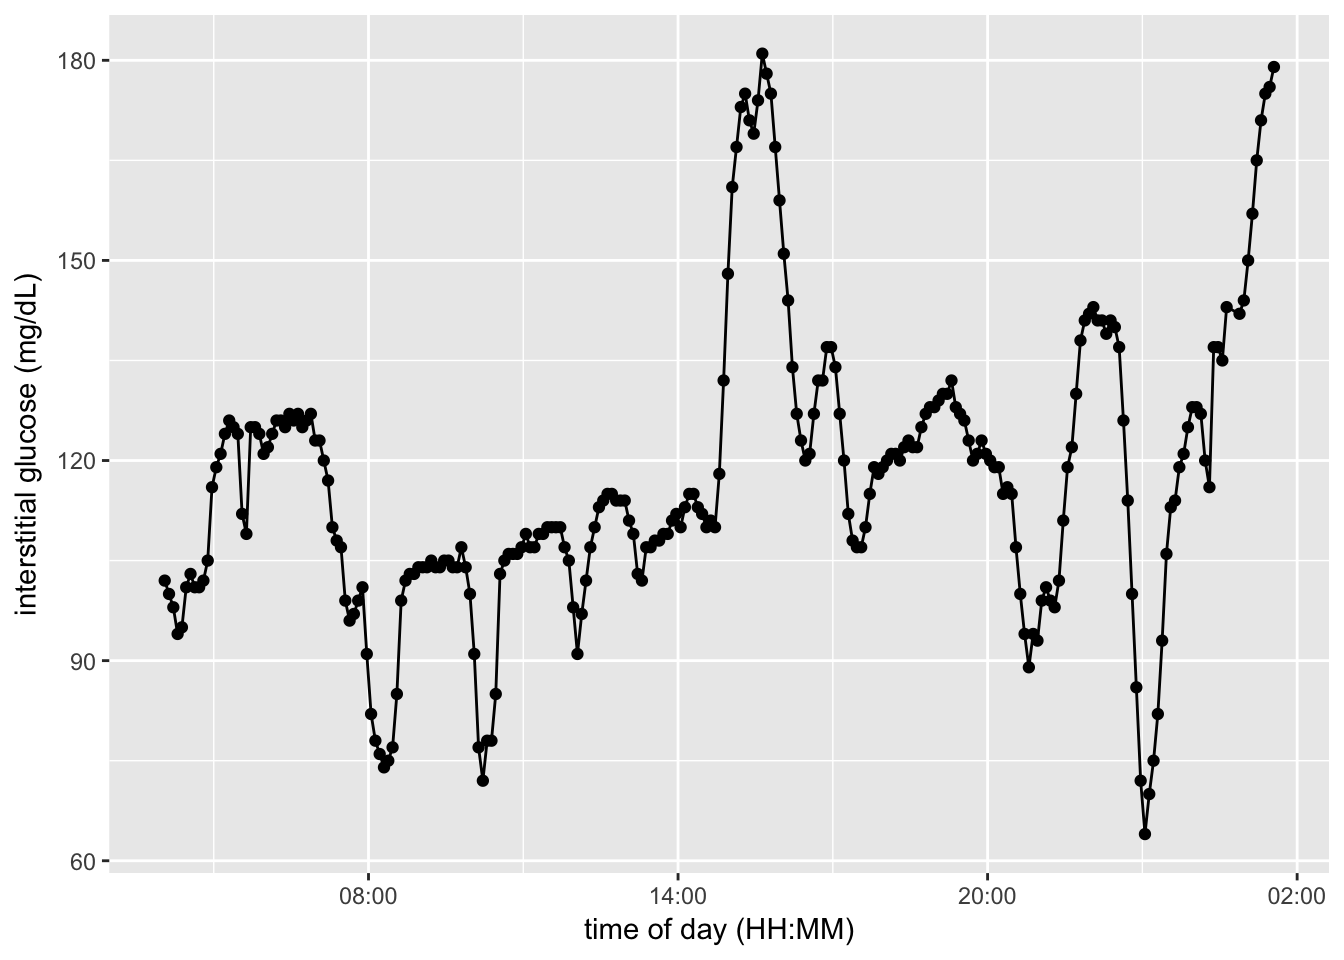
preview of food logs
current.table = food.logs[sample(1:nrow(food.logs), 10), ]
head(current.table)
                            description   food_id entry_date  category
2712                         White Rice 169888484    1/29/15      <NA>
2356 Rice - White  medium-grain  cooked 219188109     8/3/15    Dinner
2742                Whole Psyllium Husk 212702230    5/21/16    Dinner
1412               Garlic & Herb Cheese 131419740   12/19/14      <NA>
515                              Cereal 160355225    3/29/15 Breakfast
1005       Coffee - Brewed from grounds 155741288     1/9/15      <NA>
                                     amount calories total_fat
2712                                  1 cup   205.00   0.40000
2356                                  1 cup   169.26   0.27342
2742 2.5 serving(s) of  0.5 tablespoon (4g)    37.50        NA
1412                                1 wedge    50.00   3.00000
515                                   1 cup   200.00   4.00000
1005                        1 cup (8 fl oz)     4.74   0.09480
     polyunsaturated_fat monounsaturated_fat trans_fat cholesterol sodium
2712            0.100000             0.10000         0           0   2.00
2356            0.072912             0.08463         0           0   0.00
2742                  NA                  NA        NA          NA     NA
1412                  NA                  NA        NA          15 220.00
515             1.000000             1.00000         0           0 280.00
1005            0.004740             0.07110         0           0   9.48
     potassium    carbs   fiber sugar protein vitamin_a vitamin_c calcium
2712    55.000 45.00000  0.6000   0.1 4.20000         0         0  0.0000
2356    37.758 37.22418  0.3906   0.0 3.09876         0         0  0.3906
2742        NA 10.00000 10.0000    NA      NA        NA        NA      NA
1412        NA  0.50000  0.0000   0.0 3.00000         2         0 11.0000
515    360.000 40.00000  6.0000   2.0 6.00000        20        20 20.0000
1005   232.260  0.00000  0.0000   0.0 0.56880         0         0  0.9480
           iron              Food.group                food  species
2712  2.0000000                   grain                rice
2356 10.7776694                   grain                rice
2742         NA                   fiber            psyllium plantago
1412  0.0000000         dairy,vegetable       cheese,garlic
515  90.0000000 grain,grain,grain,grain wheat,corn,oat,rice
1005  0.2633335                   drink              coffee
           additional_desc
2712
2356
2742
1412
515  Cereal life by quaker
1005
preview of food timing and meal descriptions
head(food.times[sample(1:nrow(food.times), 10), ])
       Date  TIME AM_PM            Food      Meal Minus.Meal  Notes
31   4/3/15 17:20    pm            wine    dinner         NA
149 4/27/15 19:30    pm          dinner    dinner         NA unsure
1   3/29/15  9:15    am          Banana breakfast         NA
79  4/13/15  7:31    am       breakfast breakfast         NA
93  4/15/15 12:05    pm           lunch     lunch         NA
77  4/12/15 14:55    pm mandarin orange                   NA
               description
31  Wine-cabernet Savignon
149
1            Bananas - Raw
79
93
77               Clematine
Annotate glucose spikes
min.peak = 120
min.peak.height = 30
cgm.readings = markGlucosePeaks(cgm.readings, min.peak.height, min.peak)


# count number of peaks
peak.type = c("max")
number.peaks = length(cgm.readings[which(cgm.readings$peak %in% peak.type),]$peak)
print(paste(number.peaks, "total glucose spikes annotated"))
[1] "261 total glucose spikes annotated"preview of annotated glucose spikes
head(cgm.readings)
  GlucoseDisplayDate GlucoseDisplayTime GlucoseValue         DisplayTime
1            3/29/15              11:53          100 2015-03-29 11:53:00
2            3/29/15              11:58          111 2015-03-29 11:58:00
3            3/29/15              12:03          113 2015-03-29 12:03:00
4            3/29/15              12:08          114 2015-03-29 12:08:00
5            3/29/15              12:13          116 2015-03-29 12:13:00
6            3/29/15              12:18          121 2015-03-29 12:18:00
  peak timeChange glucoseChange
1    0          0             0
2  min          5           111
3    0          0             0
4    0          0             0
5    0          0             0
6    0          0             0

# get same example date
example.CGM = cgm.readings[cgm.readings$GlucoseDisplayDate == example.date, ]
example.CGM$GlucoseDisplayTime <- as.POSIXct(strptime(example.CGM$GlucoseDisplayTime, format="%H:%M"))

# show example of labeled cgm data
spike.colors = c("0" = "black", "max" = "red", "min" = "purple")
ggplot(example.CGM) +
  aes(x = GlucoseDisplayTime, y = GlucoseValue, group = GlucoseDisplayDate) +
  geom_point(aes(color = peak)) + geom_line() +
  scale_x_datetime(breaks = date_breaks("6 hour"), labels = date_format("%H:%M")) +
  scale_colour_manual(values = spike.colors) +
  labs(x = "time of day (HH:MM)", y = "interstitial glucose (mg/dL)")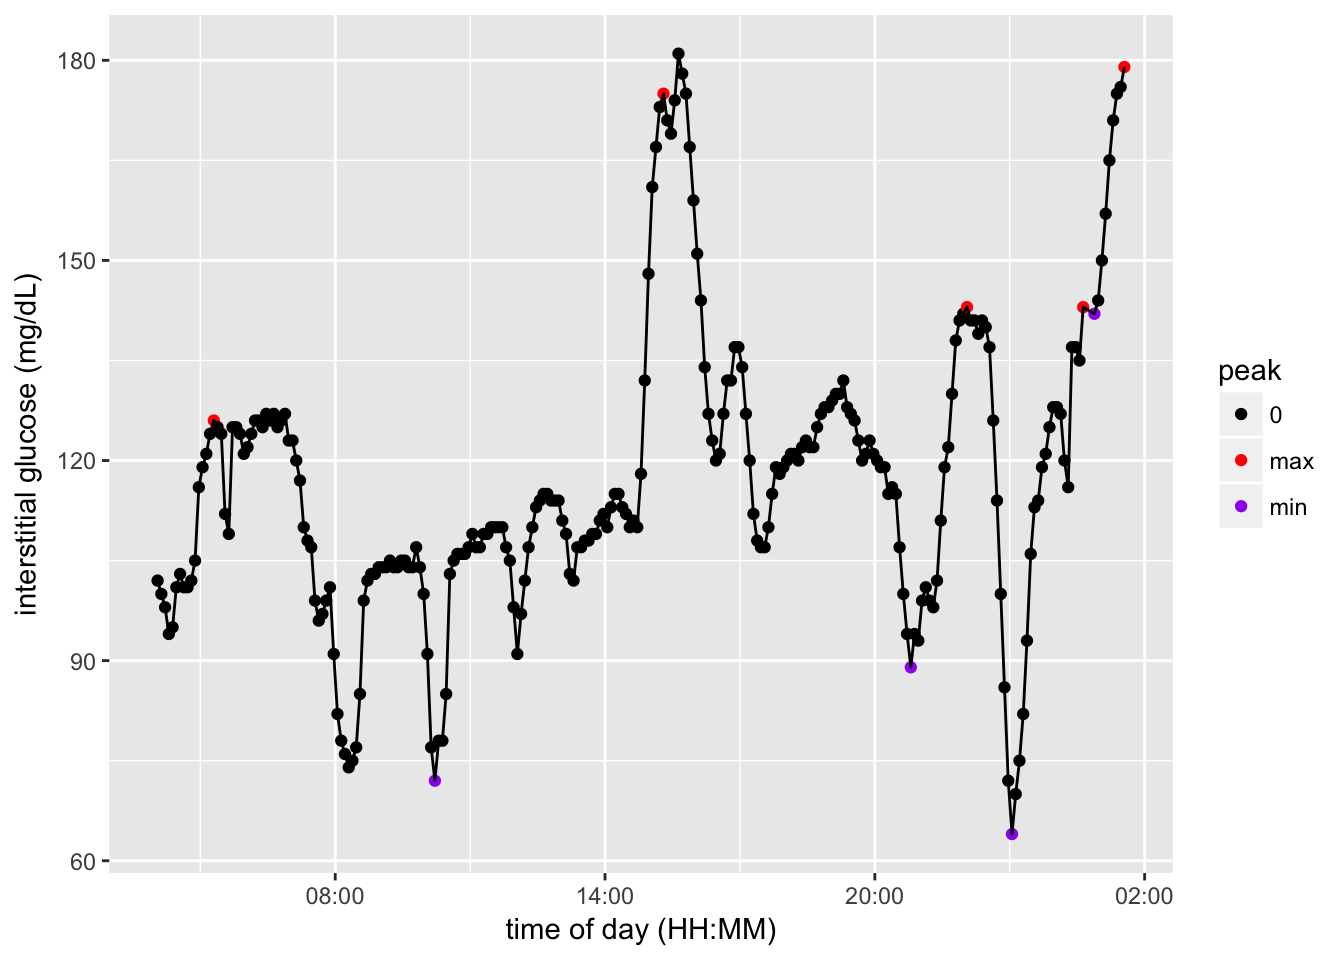
distribution of glucose concentration
peakLabeller  <- as_labeller(c(
    "0" = "all data",
    "max" = "spikes (max)",
    "min" = "nadirs (min)"
  ))

ggplot(cgm.readings) +
  aes(x = GlucoseValue, group = peak, fill = peak) +
  geom_density(alpha = 0.3) +
  ggtitle("Distribution of interstitial glucose concentrations") +
  facet_wrap(~peak, labeller=peakLabeller) +
  theme(legend.position="none")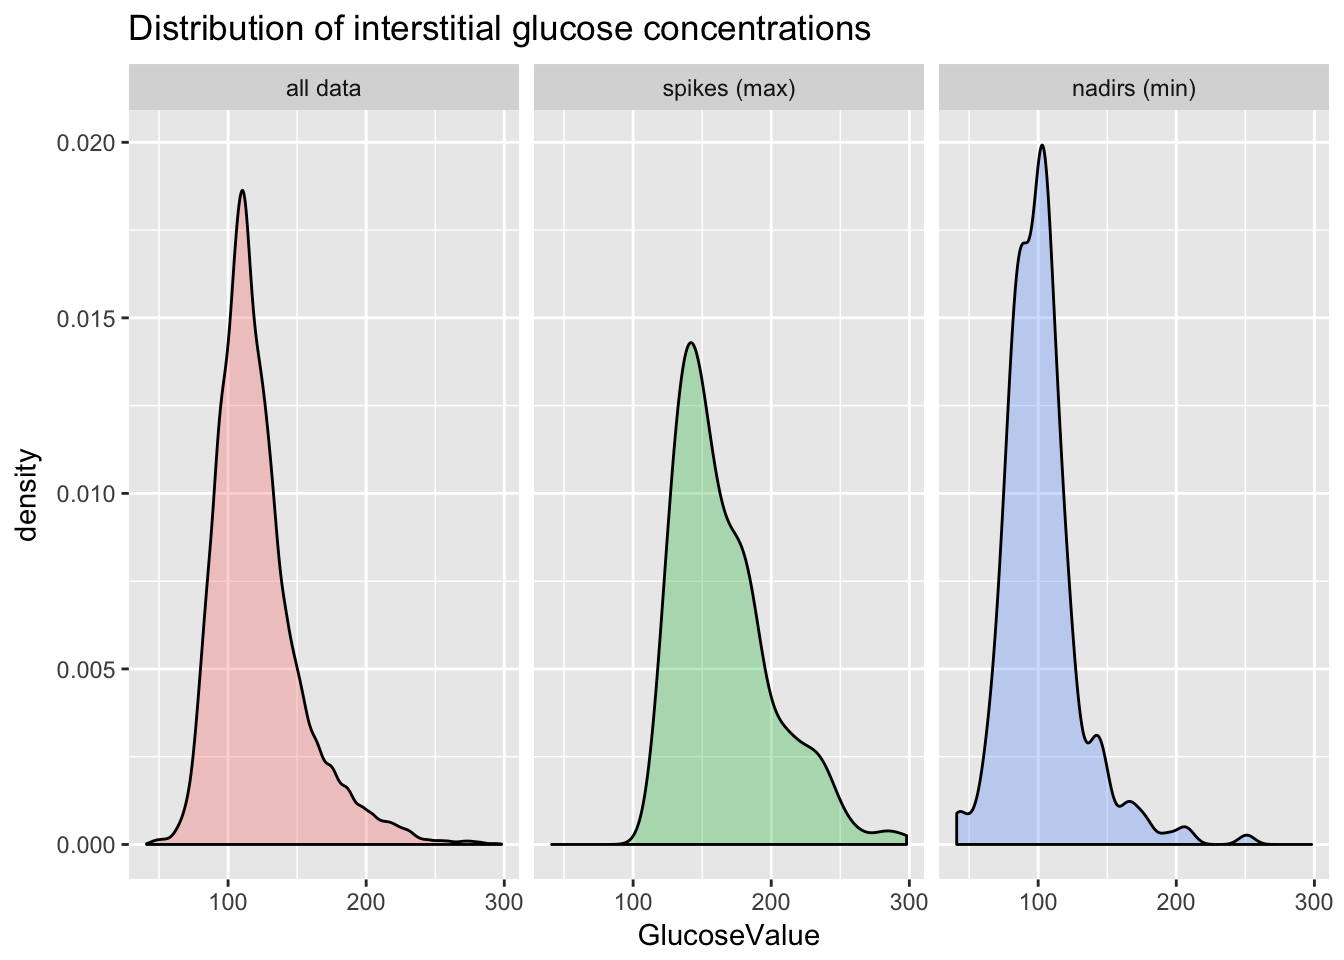
Data exclusion
# keep only glucose spikes
# --------------------------
cgm.readings = cgm.readings[cgm.readings$peak == peak.type,]

# keep only dates with recorded meal times
# --------------------------------
dates.with.meal.times <- unique(food.times$Date)
cgm.readings <- cgm.readings[which(cgm.readings$GlucoseDisplayDate %in% dates.with.meal.times),]

# count number of peaks
peaks.remaining = length(cgm.readings[which(cgm.readings$peak %in% peak.type),]$peak)
print(paste(peaks.remaining, "peaks remaining with meal data"))
[1] "201 peaks remaining with meal data"# remove travel from glucose data and food timing
# --------------------------------
cgm.readings = removeTravelDates(cgm.readings, travel.file, TZ.path)
food.times = food.times[food.times$Date %in% cgm.readings$GlucoseDisplayDate, ]
# print number of days removed from travel
peaks.post.travel = length(cgm.readings[which(cgm.readings$peak %in% peak.type),]$peak)
print(paste(peaks.post.travel, "peaks remaining after excluding travel"))[1] "157 peaks remaining after excluding travel"Session information
sessionInfo()R version 3.3.3 (2017-03-06)
Platform: x86_64-apple-darwin13.4.0 (64-bit)
Running under: OS X El Capitan 10.11.6
locale:
[1] en_US.UTF-8/en_US.UTF-8/en_US.UTF-8/C/en_US.UTF-8/en_US.UTF-8
attached base packages:
[1] grid parallel splines stats graphics grDevices utils
[8] datasets methods base
other attached packages:
[1] scales_0.4.1 ggplot2_2.2.1 gtable_0.2.0
[4] gridExtra_2.2.1 randomForest_4.6-12 gbm_2.1.3
[7] lattice_0.20-35 survival_2.41-3 kknn_1.3.1
[10] leaps_3.0 lubridate_1.6.0
loaded via a namespace (and not attached):
[1] igraph_1.0.1 Rcpp_0.12.10 knitr_1.17 magrittr_1.5
[5] munsell_0.4.3 colorspace_1.3-2 plyr_1.8.4 stringr_1.2.0
[9] tools_3.3.3 git2r_0.19.0 htmltools_0.3.5 lazyeval_0.2.0
[13] yaml_2.1.14 rprojroot_1.2 digest_0.6.12 tibble_1.3.0
[17] Matrix_1.2-8 evaluate_0.10.1 rmarkdown_1.6 labeling_0.3
[21] stringi_1.1.5 backports_1.0.5 This R Markdown site was created with workflowr